Hey there, bargain hunter.
For most of the past decade, owning small caps felt like a consolation prize. Year after year, the Magnificent 7 vacuumed up capital, index returns were increasingly driven by a handful of trillion-dollar companies, and the argument for small caps was a historical footnote that never quite paid off in practice.
2026 is different. And the numbers are starting to get hard to ignore.
The Numbers
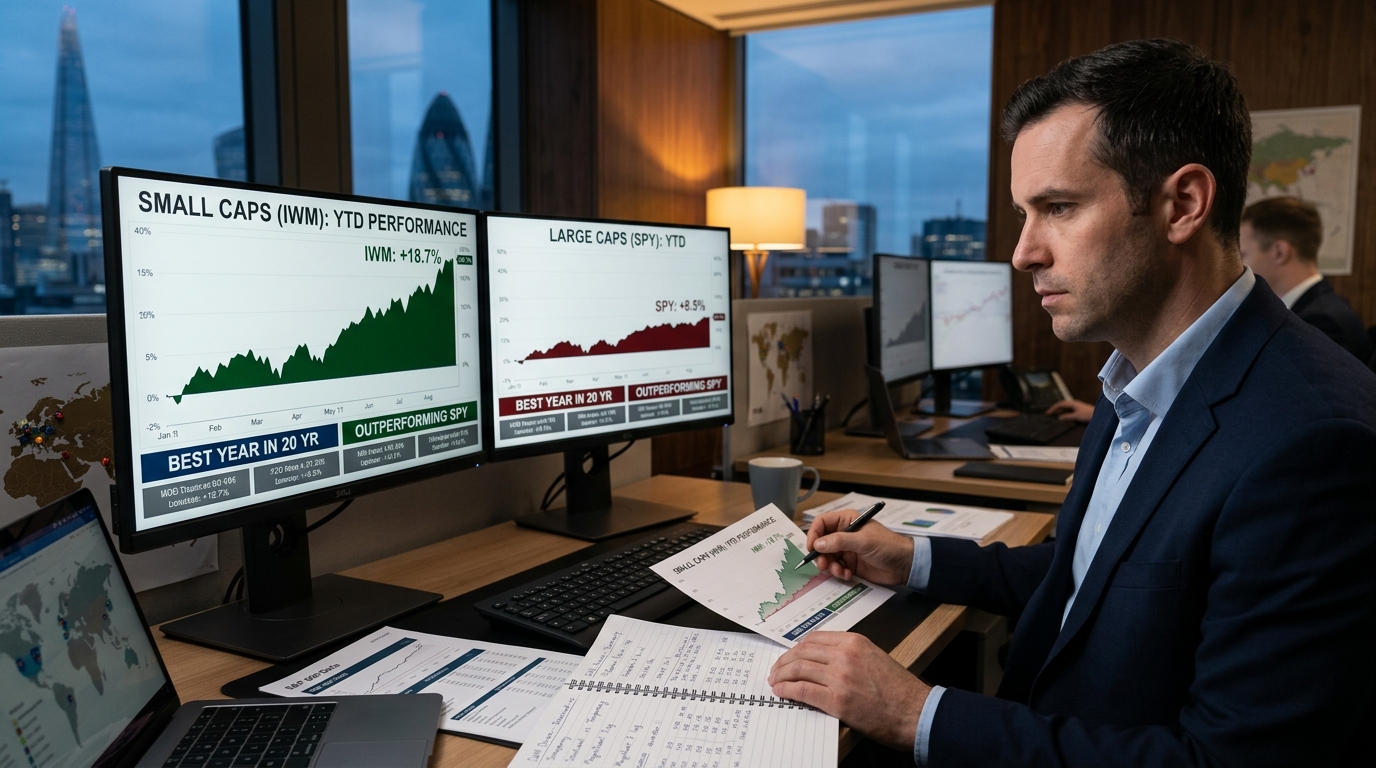
U.S. small-cap stocks are off to their strongest relative start to a year in more than two decades. As of mid-June, the iShares Russell 2000 ETF (IWM) is outperforming the SPDR S&P 500 ETF Trust (SPY) by approximately 10 percentage points year-to-date. The Russell 2000 itself recently crossed 2,961 points, climbing 0.76% in a single session as investors continued rotating toward smaller companies.
The last time small caps led by this kind of margin at this point in the calendar year, the dot-com bubble was still unwinding. That comparison is not made lightly.
What Is Actually Driving This
Three things converged. Not one. Not two. Three.
First, the One Big Beautiful Bill Act. Signed in mid-2025, the OBBBA’s most powerful provisions kicked in January 1, 2026. It made permanent the 21% corporate tax rate and restored immediate R&D expensing. It also moved the business interest deduction cap to an EBITDA-based calculation, which disproportionately benefits smaller, more leveraged companies. Bank of America estimates the consumer stimulus component alone could deliver $135 to $140 billion into the economy, translating to more than $1,000 per household during tax season. Small companies with domestic revenue concentration benefit from that more directly than any global mega-cap.
Second, the rate cycle. After three 25-basis-point cuts in late 2025, the federal funds rate settled into a 3.50% to 3.75% range. Small caps carry significantly more floating-rate debt than their large-cap counterparts. Lower rates don’t just cut interest expense. They change the cost of capital equation for every acquisition, every capex project, every refinancing decision these companies make. The benefit is real and it compounds.
Third, the valuation gap. After years of mega-cap dominance, the gap between small-cap and large-cap valuations was at historically extreme levels entering 2026. Enterprise value to EBIT metrics showed the Russell 2000 trading near multi-year lows relative to the Russell 1000. That kind of discount doesn’t persist forever.
The Part That Is Still Being Underestimated
Here is where it gets interesting. Most investors who have noticed the small-cap trade are treating it like a tactical rotation. Buy IWM, wait for the mean reversion, rotate back to tech. That framing probably misses the duration of what is unfolding.
Morgan Stanley strategists have described this as the early innings of a multi-year leadership change. The projection is that the median stock will continue to see earnings growth outpace the tech giants through 2027, as OBBBA benefits and stable rates permeate the economy. Small caps are projected to post earnings growth of 30% to 35% this year, significantly ahead of the 22% expected from the Magnificent 7.
Small caps showed a 65% earnings beat rate in the last reporting cycle. That is not noise.
There is also a structural tailwind from the reconstitution. The June 2026 Russell reconstitution data showed that 97 existing Russell 2000 constituents ranked above the Russell 1000 breakpoint on market cap, a sign that small caps themselves are graduating upward. The market is broadening, not just rotating.
What Could Go Wrong
Be honest with yourself here. Small caps experience drawdowns roughly 40% deeper than large caps during corrections. If inflation re-accelerates and the Fed pivots hawkish, floating-rate debt becomes a liability again instead of an opportunity. Geopolitical shocks, a slowing consumer, and any GDP miss would hit the Russell 2000 harder and faster than the S&P 500.
The risk is not that the thesis is wrong. It is that the entry timing matters more in small caps than almost anywhere else.
There is also a crowding risk building. Large-cap growth funds that spent five years overweight in tech are now being forced to chase the rotation late. When they buy, they can drive valuations temporarily above fair value. That creates a whipsaw risk for anyone entering at the wrong moment.
The Actionable Part
Simply buying IWM captures the trend but the variance within the Russell 2000 is wide. The rotation rewards selectivity. The specific characteristics worth screening for right now: domestic revenue concentration, floating-rate debt that was already refinanced to fixed in late 2025, infrastructure or defense sector ties with OBBBA contract exposure, and regional banking or Main Street consumer exposure.
Regional banks are worth a specific mention. Citizens Financial Group (CFG) has outperformed its large-bank peers as OBBBA small business lending incentives revitalize a model that had been squeezed for years. That is not a one-company story. It is a sector dynamic.
Bloom Energy is one concrete example of the reconstitution dynamic. It grew well beyond the Russell 2000 breakpoint and moved into the Russell 1000 this cycle, a price catalyst that tends to precede sustained institutional buying as large-cap index funds are forced to add the name.
The Russell reconstitution officially hits June 27. One week away. Passive flows are already moving. Most traders watching the S&P 500 for their market cues are looking at the wrong index right now.
The opportunity isn’t invisible. It’s just not where most people are paying attention.